Don’t believe everything you’ll find online. If you work in a moderately complex environment (meaning, you’re running a managed server instance via an admin server instance on WebLogic), you’re sure to be led astray by the dozens of articles offering guidance into this elusive technique. You don’t have to emulate Ray Milland, if you follow this advice:
If you Google “Remote debugging WebLogic” you’ll find a host of discussions about modifying the startWebLogic.cmd or startWLS.cmd files. Ignore them all (assuming you’re using WebLogic 8.1 or later)! (Also remember, never verb a noun.)
Let me review the scenario that I am actually addressing here:
- You will be remote-attaching to a running WebLogic instance, rather than launching the instance from within your IDE. (I use Eclipse, because I’m cheap—and because version 3.1.1 really works great, unlike its predecessors—but these instructions apply to just about anything.)
- You run your WebLogic application as an instance under a WebLogic managed server, and start/stop it using the Remote Start options in the WebLogic console.
- You’ve tried desperately to get your debugger to attach, or your breakpoints to be hit, to no avail.
- You have deadlines looming, and if you don’t get this one problem solved, you can never see your family again.
Okay, perhaps I went a bit overboard on the scenario, but if you’re reading this, I expect, like me, BEA’s WebLogic isn’t a platform you use every day, but one that you need to work on occasionally.
The key is that most of the documentation presumes you won’t be running your application from the WebLogic Server Console, and gives no indication that the JVM arguments, in such a case, go in a completely different place. Here’s how to prove to the world that you weren’t going insane:
- Log on to the WebLogic console, via http://{servername}:9999/console. YMMV as far as the port number (after {servername}) is concerned.
- Using the navigation tree, click on the domain on which your application resides, open the Servers branch beneath it, and click on your application’s name.
- With the Configuration tab in the top row selected, click on the Remote Start tab in the second row. (Be sure you don’t have Control selected in the top row, otherwise you’ll think I am just as batty as the authors of the previous 743 help documents you’ve read.)
- Scroll down to the Arguments: field, and add your debug settings to the JVM arguments in that field. In my case, I added
-Xdebug -Xrunjdwp:transport=dt_socket,address=8787,server=y,suspend=n, which (among other things that are too cool for me to share) allows the debugger to attach to port 8787 (address=8787), and the server to start without waiting for a debugger to attach (suspend=n). - Click on Apply.
- Then click on Control in the first row of tabs, and be sure Start/Stop is selected in the second row of tabs.
- Finally, you’ll need to either gracefully or forcefully shut down the server by using the links provided, and then restart the server. (You’re actually only restarting your application; the ambiguous language surrounding server is another problem.)
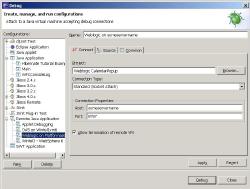
- Attach Eclipse to the server by Configuring a new Remote Java Application under Debug … Feed it parameters of the server name and 8787 (or whatever port you provided in the JVM arguments).
- Debug your problem.
- For goodness’ sake, go home and see your family!
Drop me an e-mail using the link in the sidebar, or leave a comment, if I’ve goofed anywhere. I never claimed to be perfect. Sheesh.


Reading this was like trying to translate one of Beth’s physiology explanations. You two are definitely in the right fields for you!
I knew there was a reason I liked you…